How Many Tokens I Used in February 2026
- 603.8M tokens excluding cache, 2.11B including cache, with an API-equivalent estimate of $1,962.01
- Peak usage landed at 1 AM Eastern, largely driven by overnight automation and late-night work sessions
- Codex dominated non-cached usage at 99.74%, while Claude rose to 44.53% when cache activity was included
Running several personal projects in parallel made me suddenly curious: how many tokens did I actually use in one month?
Since I’m on subscription plans, the billing pressure is lower than it would be with raw API usage. Still, understanding the pattern seemed useful. If I know where the tokens are going, I can make better decisions about automation, tool choice, and workflow design.
So I pulled a month of local session logs and normalized everything in Eastern Time. For simplicity, I refer to the time zone as EST throughout this post.
Before getting into the numbers, here’s the distinction I use:
- Excluding cache = input + output
- Including cache = excluding cache + cache_read + cache_write
February Token Usage Analysis
The headline numbers
| Metric | Value |
|---|---|
| Total tokens (excluding cache) | 603,760,491 |
| Total tokens (including cache) | 2,108,917,715 |
| Peak hour (EST) | 1 AM |
| Peak hourly usage | 71,280,115 |
| Estimated API-equivalent cost | $1,962.01 |
On a non-cached basis, I used about 603.8M tokens. If I include cache activity, the number rises above 2.11B. The non-cached figure is closer to the amount of newly processed work, but the bigger story is the pattern behind those numbers.
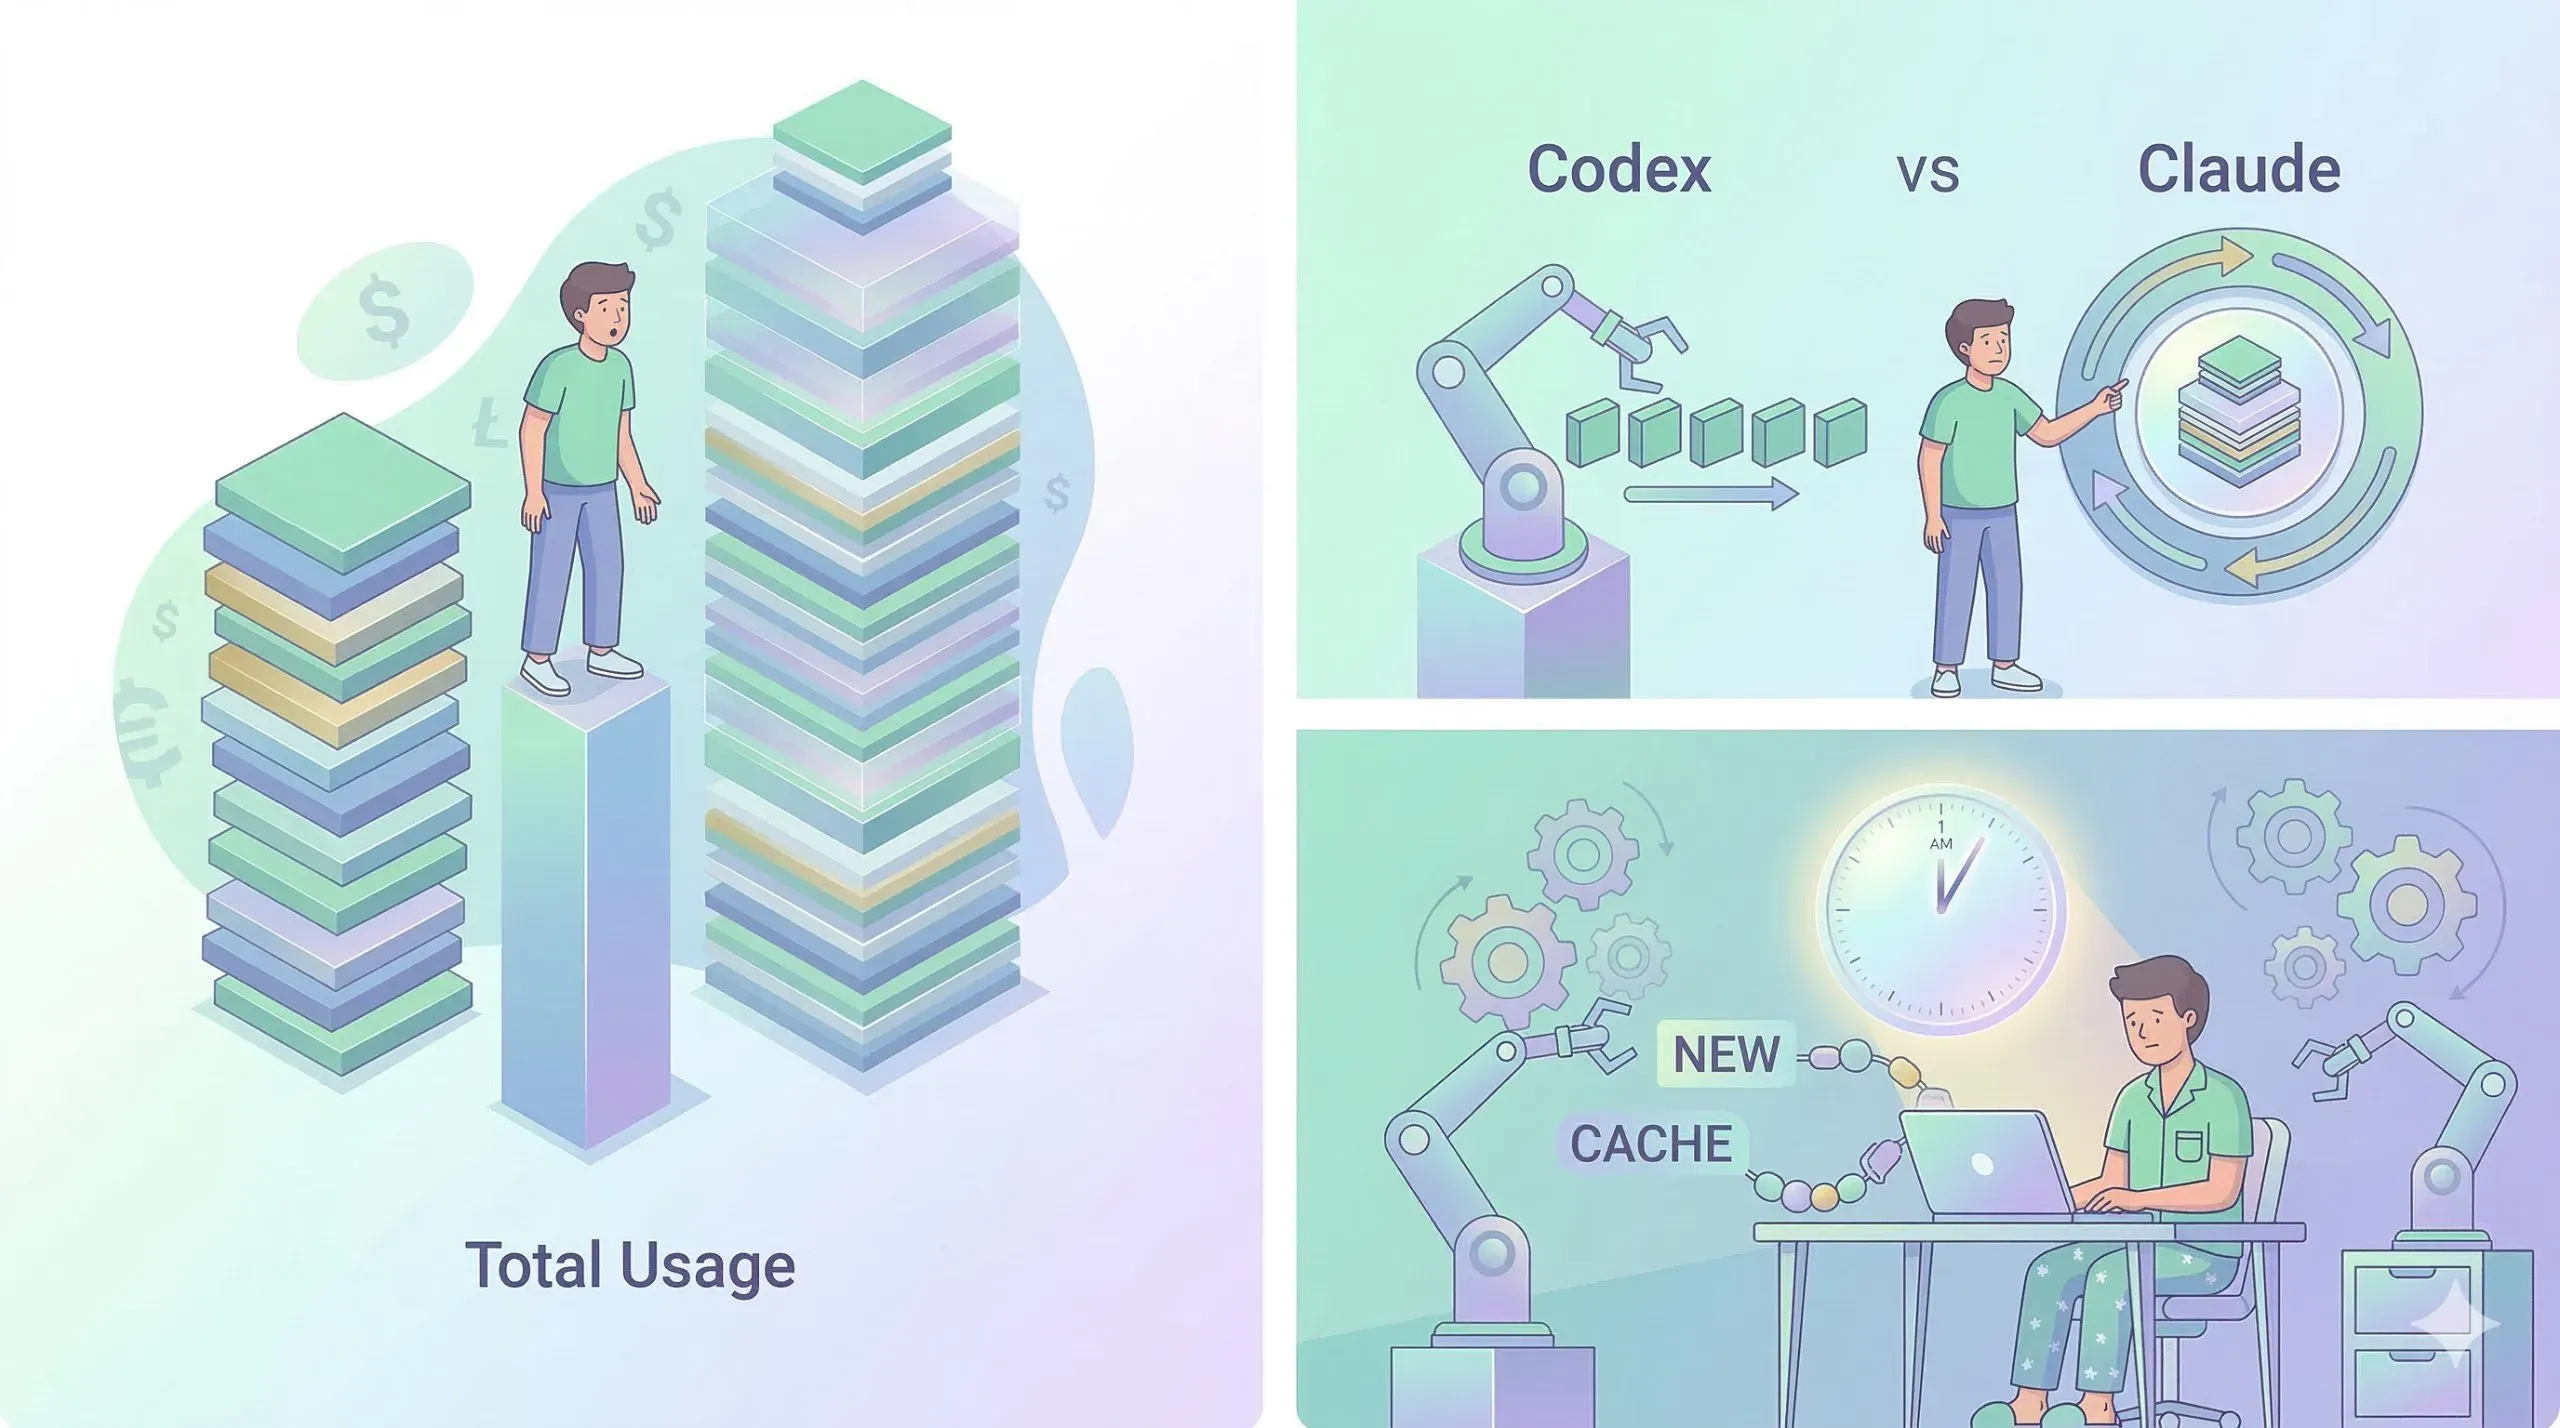
Infographic
Codex vs Claude: cache changes the picture
If I look only at tokens excluding cache, Codex completely dominates.
| Basis | Codex | Claude |
|---|---|---|
| Excluding cache | 602,189,887 (99.74%) | 1,570,604 (0.26%) |
| Including cache | 1,169,852,991 (55.47%) | 939,064,724 (44.53%) |
Without cache, Codex accounts for 99.74% of usage. Once cache is included, Claude jumps to 44.53%.
That suggests two different usage patterns at once: Codex handled almost all of the newly processed tokens, while Claude generated a large amount of cache reuse.
That aligns with how I tend to use Claude Code. When a long-lived session keeps reusing the same context efficiently, cache hit rates can get very high. From a processing-cost perspective, that means the real burden may be lower than the total token count initially suggests.

Why does Claude Code use so much cache?
After seeing the numbers, I wanted to understand whether they actually made sense.
Claude Code builds a large prefix at session start, including the system prompt, 18+ tool definitions, git history, CLAUDE.md, and other context. That prefix can exceed 20,000 tokens. Claude Code then runs a warm-up step that effectively gets this prefix into cache early in the session.
The important part is what happens during context compaction. When the context window fills up, Claude Code summarizes the conversation, but the system prompt, tool definitions, and CLAUDE.md remain effectively stable. That means the KV cache for the shared prefix can still be reused even after compaction.
When cache hits occur, cached tokens are billed at only 10% of normal input token cost. Codex, by contrast, tends to process more fresh context per request, so cache reuse shows up far less prominently in the numbers. The architectural difference between the two tools ends up being visible in the usage data.
What happened at 1 AM?
The top five hourly buckets, excluding cache, peak around 1–2 AM.
| Rank | Time (EST) | Tokens |
|---|---|---|
| 1 | 01:00 | 71,280,115 |
| 2 | 02:00 | 48,578,199 |
| 3 | 08:00 | 43,119,144 |
| 4 | 11:00 | 43,112,864 |
| 5 | 12:00 | 42,137,591 |
My best guess is that this comes from my habit of setting up automation before going to sleep. A lot of overnight runs end up landing in the early morning hours. Since parenting usually knocks me out around 10–11 PM, the biggest spikes tend to happen on Friday or Saturday nights, when I can stay up later, queue more work, and sometimes keep working manually as well.
If I group usage into six-hour blocks, the 12:00–17:00 window is the biggest at 31.63%.
| Time block (EST) | Tokens | Share |
|---|---|---|
| 00-05 | 164,659,603 | 27.27% |
| 06-11 | 157,139,181 | 26.03% |
| 12-17 | 190,989,762 | 31.63% |
| 18-23 | 90,971,945 | 15.07% |
How I measured it
I cross-checked the numbers using three sources: Claude logs, Codex logs, and third-party tools such as ccusage and CodexBar.
- Claude:
~/.claude/projects/**/*.jsonl- Grouped by
(sessionId, requestId), then resolved mixed intermediate/final usage records by taking the max value per field
- Grouped by
- Codex:
~/.codex/sessions/**/*.jsonltotal_token_usageis cumulative, so I sorted events chronologically within each session and summed only deltas, ignoring decreases
- CodexBar: used only as a reference for account state and daily credit visibility
- It was not detailed enough for time-of-day analysis
Because Claude and Codex expose different usage fields, I normalized both onto a shared schema before comparing them. Timestamps were converted from UTC into Eastern Time and then bucketed by hour.
What stands out after looking at the data
The difference in usage behavior between the two tools is what I find most interesting. Codex seems to handle almost all of the fresh-token processing, while Claude Code leans heavily on cache reuse. In other words, one is showing up mainly as raw throughput, and the other as efficient reuse.
If I compare this against usage limits, the picture shifts again. CodexApp was offering a 2x rate-limit event, and under that setup Claude consumed roughly 90% of my monthly allowance, while Codex was still only around 40–50%. Codex looks roomier from a limit perspective.
That said, I’m on the Max x5 plan for Claude, and in terms of value against actual use, it still feels quite efficient.
A lot of this increase in token usage is really a side effect of OpenClaw. Once I automate recurring work with cron jobs and make it easy to trigger personal project tasks from anywhere, tokens keep getting consumed even during otherwise idle time.
For context, these numbers come from one personal work laptop. I also use Antigravity for E2E testing and inside the IDE, and I use Gemini CLI separately, but those were messy enough to exclude from this analysis. Anything routed through OpenRouter or Google AI API keys is also missing. If I included Codex/Cursor usage from a company laptop and costs from another personal laptop too, the monthly total would be noticeably higher.
What if this weren’t a subscription?
This is not my real bill. It’s an API price-equivalent estimate.
Right now I’m paying for Max x5 and ChatGPT Pro, and considering that I only started using Codex around the middle of February, the volume is already pretty substantial. If all of this had been paid directly at API pricing, the estimate looks like this:
| Service | Estimated cost (USD) |
|---|---|
| Codex (based on gpt-5.3-codex pricing) | $1,223.20 |
| Claude (based on ccusage calculate) | $738.81 |
| Total | $1,962.01 |
Looking only at Claude, Opus-family models account for most of the cost.
| Model | Estimated cost (USD) |
|---|---|
| claude-opus-4-6 | $479.41 |
| claude-opus-4-5 | $97.25 |
| claude-sonnet-4-5 | $93.52 |
| claude-sonnet-4-6 | $59.00 |
| claude-haiku-4-5 | $9.63 |
Since Opus is the expensive tier, that pushes the Claude-side estimate up. Even so, compared with the Max x5 subscription price, direct API usage would still have been much more expensive. Codex also looks impressive here: thanks to the temporary 2x rate limit, it handled this amount of work while still staying well below the ceiling.
Closing thoughts
Seeing 2.11B tokens written out makes the scale feel more real. The pattern is interesting on its own, but it also gives me ideas for how to optimize the workflow going forward.
That said, this is still only part of the picture. It does not include tokens from company work on large codebases that consume a lot of context, and if I also include usage through OpenRouter, Gemini, and similar tools, the real total is probably closer to 8B tokens. Looking at it that way, you can really feel how much cheaper LLM usage has become.
And since I only started using these tools seriously around the second week of February, March should be even more interesting.